
记录如何基于Docker搭建监控系统
StatsD
StatsD 用于统计和聚合系统的指标数据
- StatsD client
拥有多语言实现,用于将数据发送到StatsD Server - StatsD daemon
监听StatsD client 发送的数据并整合数据发送(默认每10s)到后端 - 监控后端 Graphite、influxDB
StatsD 协议
StatsD采用简单的行协议,StatsD Server默认采用UDP协议,可配置为 TCP协议
1 | <bucket>:<value>|<type>[|@sample_rate] |
StatsD Metric Types
- Counting
计数
1 | people.number:10|c -- people.number +10 |
- Timing
记录操作耗时,StatsD 会计算出平均值、标准差、最大值、最小值
people.number.api.mean_$PCT
people.number.api.sum_$PCT
people.number.api.upper_$PCT
- PCT表示百分比阀值,可配置
1 | people.number.api:10|ms |
- Gauges
在flush后值不会被清零
1 | cat.food.amount:10|g -- cat.food.amount +10 |
- Sets
统计不重复的值有多少个
1 | active.people.id:2|g -- active.people.id +1 |
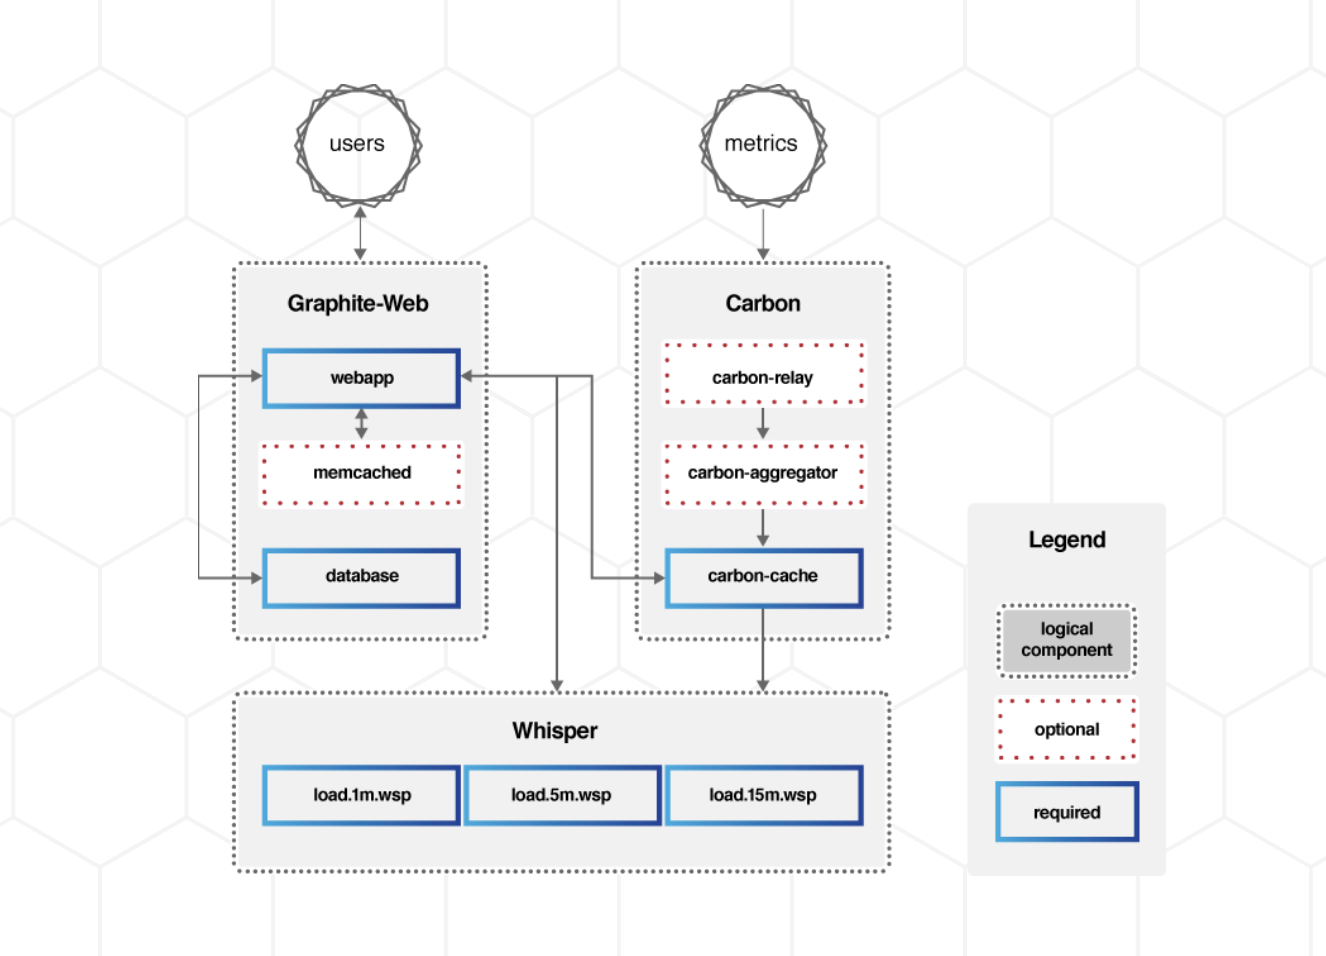
Graphite
Graphite 由三部分构成
- carbon
监听时间序列数据 - whisper
存储时间序列数据 - graphite-web
展示时间序列数据
Graphite & StatsD 安装
1 | docker run -it --name graphite --restart=always -p 8080:80 -p 2003-2004:2003-2004 -p 2023-2024:2023-2024 -p 8125:8125/udp -p 8126:8126 -d graphiteapp/graphite-statsd |
访问Graphite
1 | http://host:8080/dashboard |
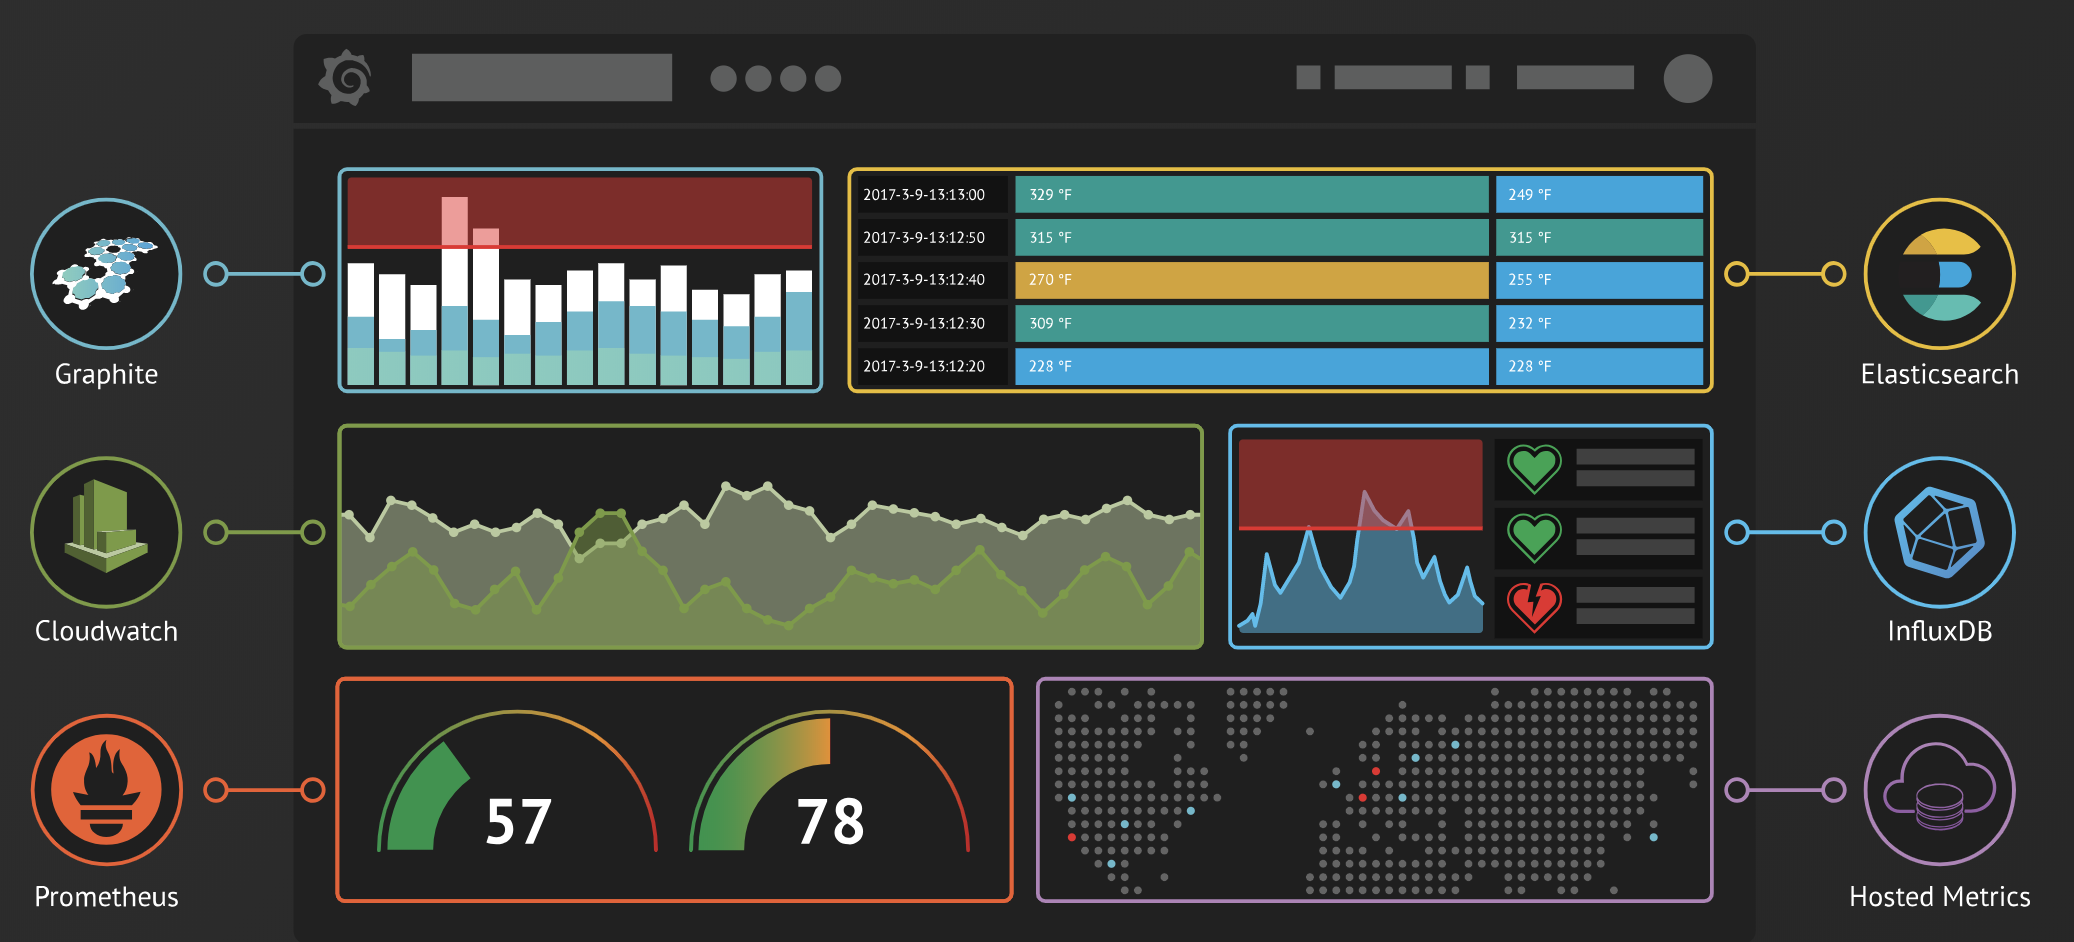
Grafana
官方是这么说的:
No matter where your data is, or what kind of database it lives in, you can bring it together with Grafana. Beautifully
Grafana安装
1 | docker run -it --name=grafana --restart=always -p 3000:3000 -d grafana/grafana |
访问Grafana
1 | http://host:3000 |
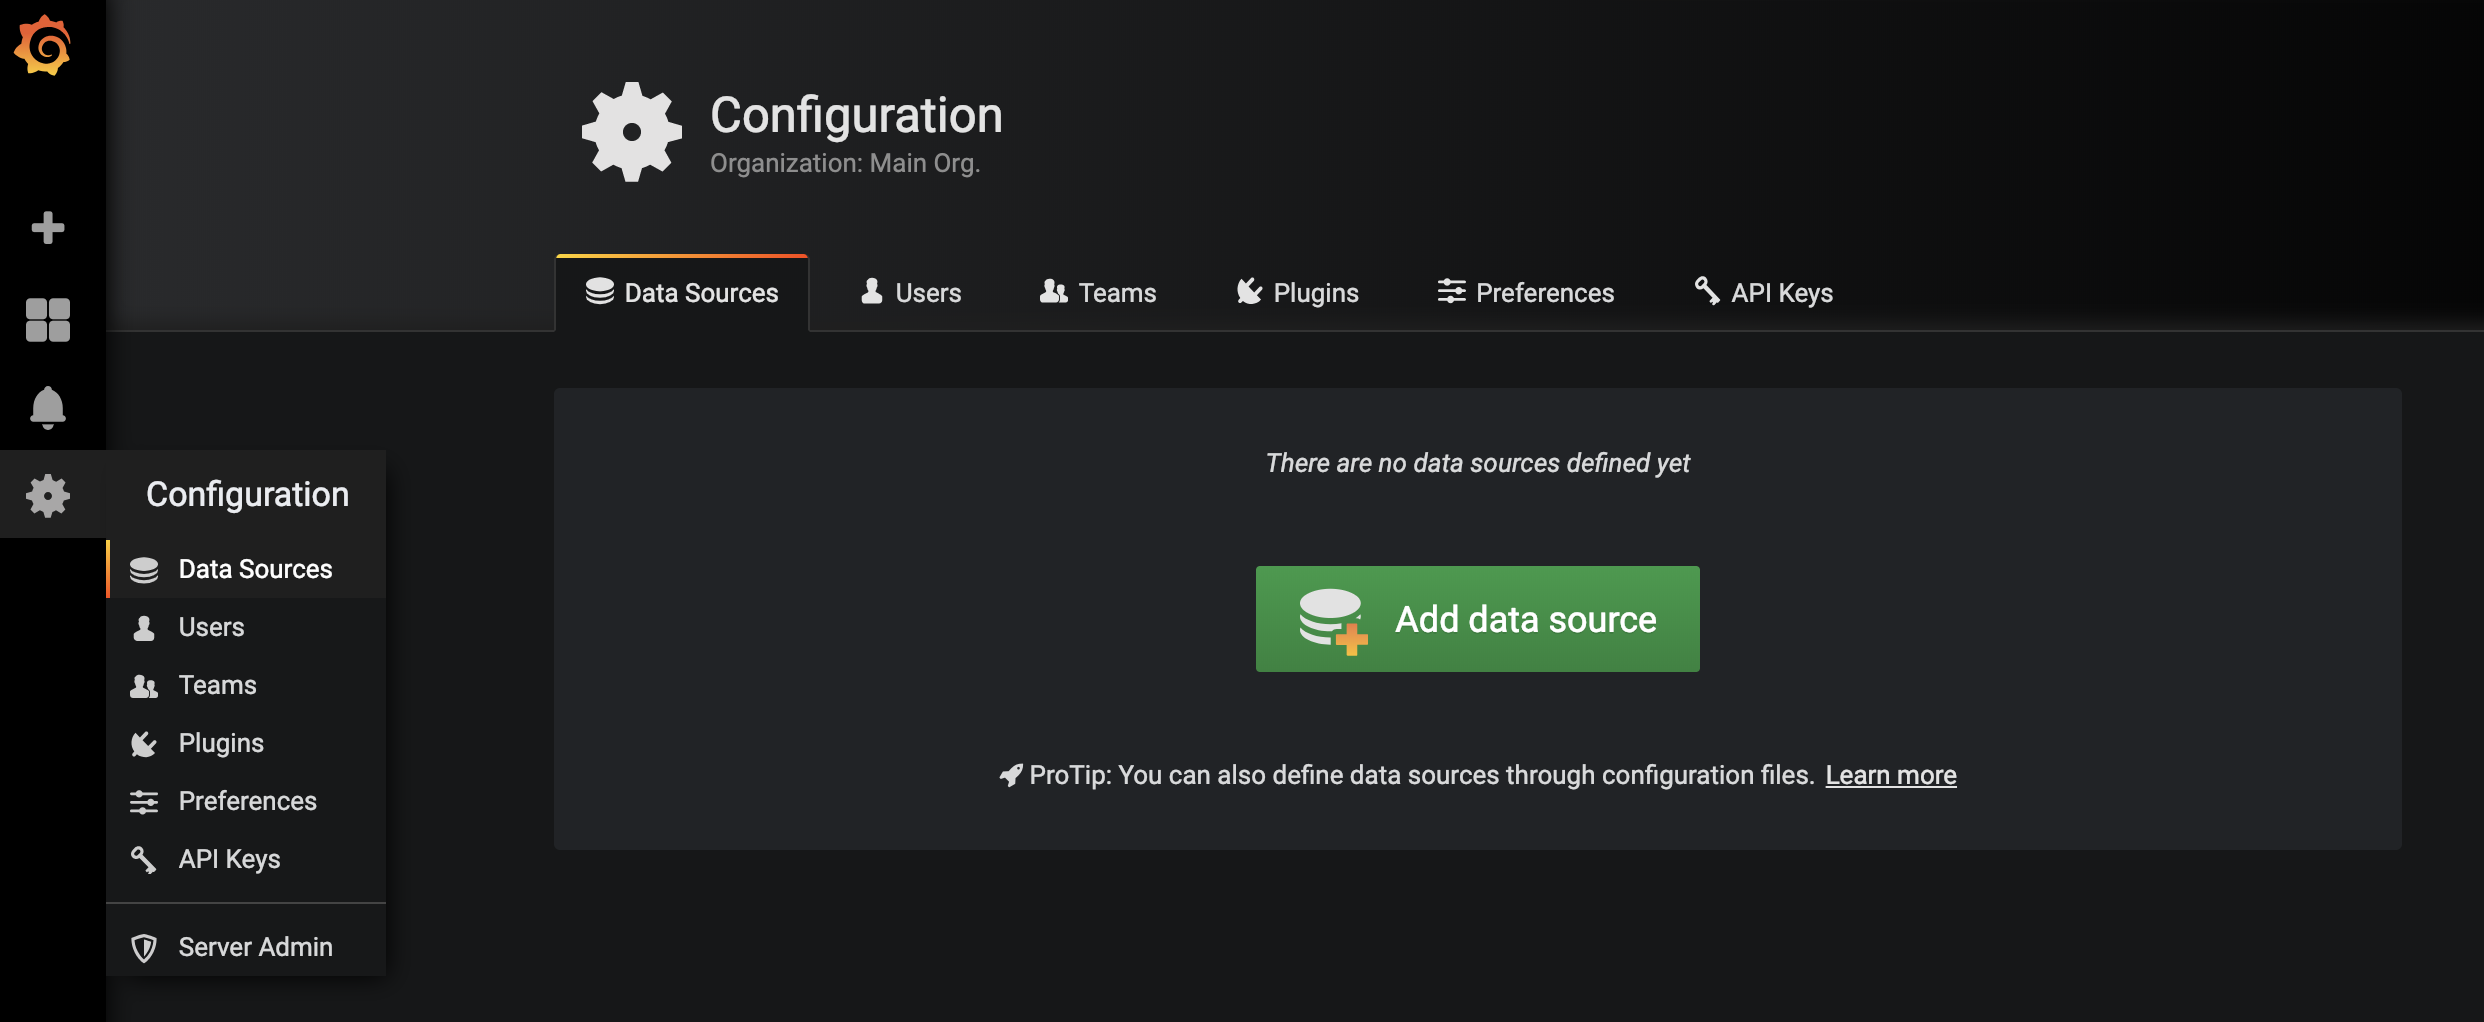
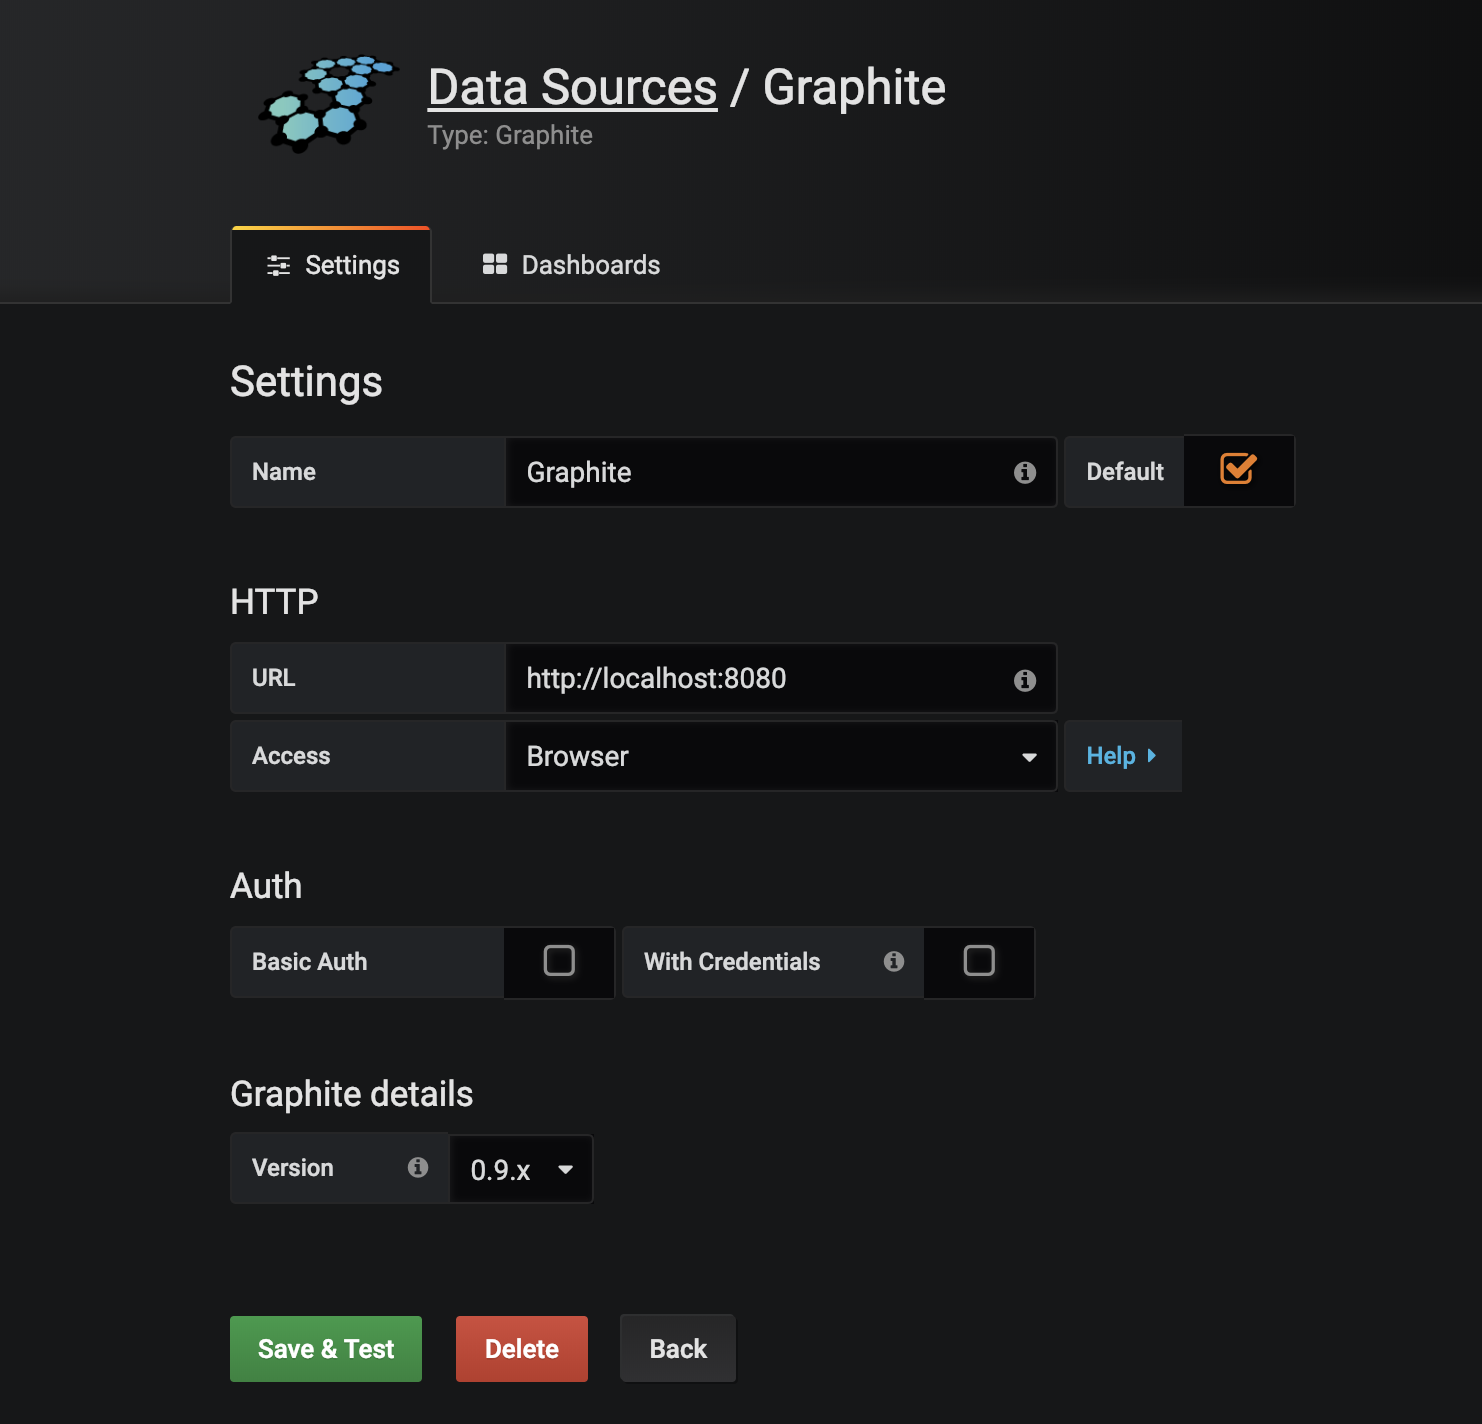
配置数据源
Metrics数据模拟
1 | while true; do echo -n "people.number:$((RANDOM % 100))|c" | nc -w 1 -u 127.0.0.1 8125; done |
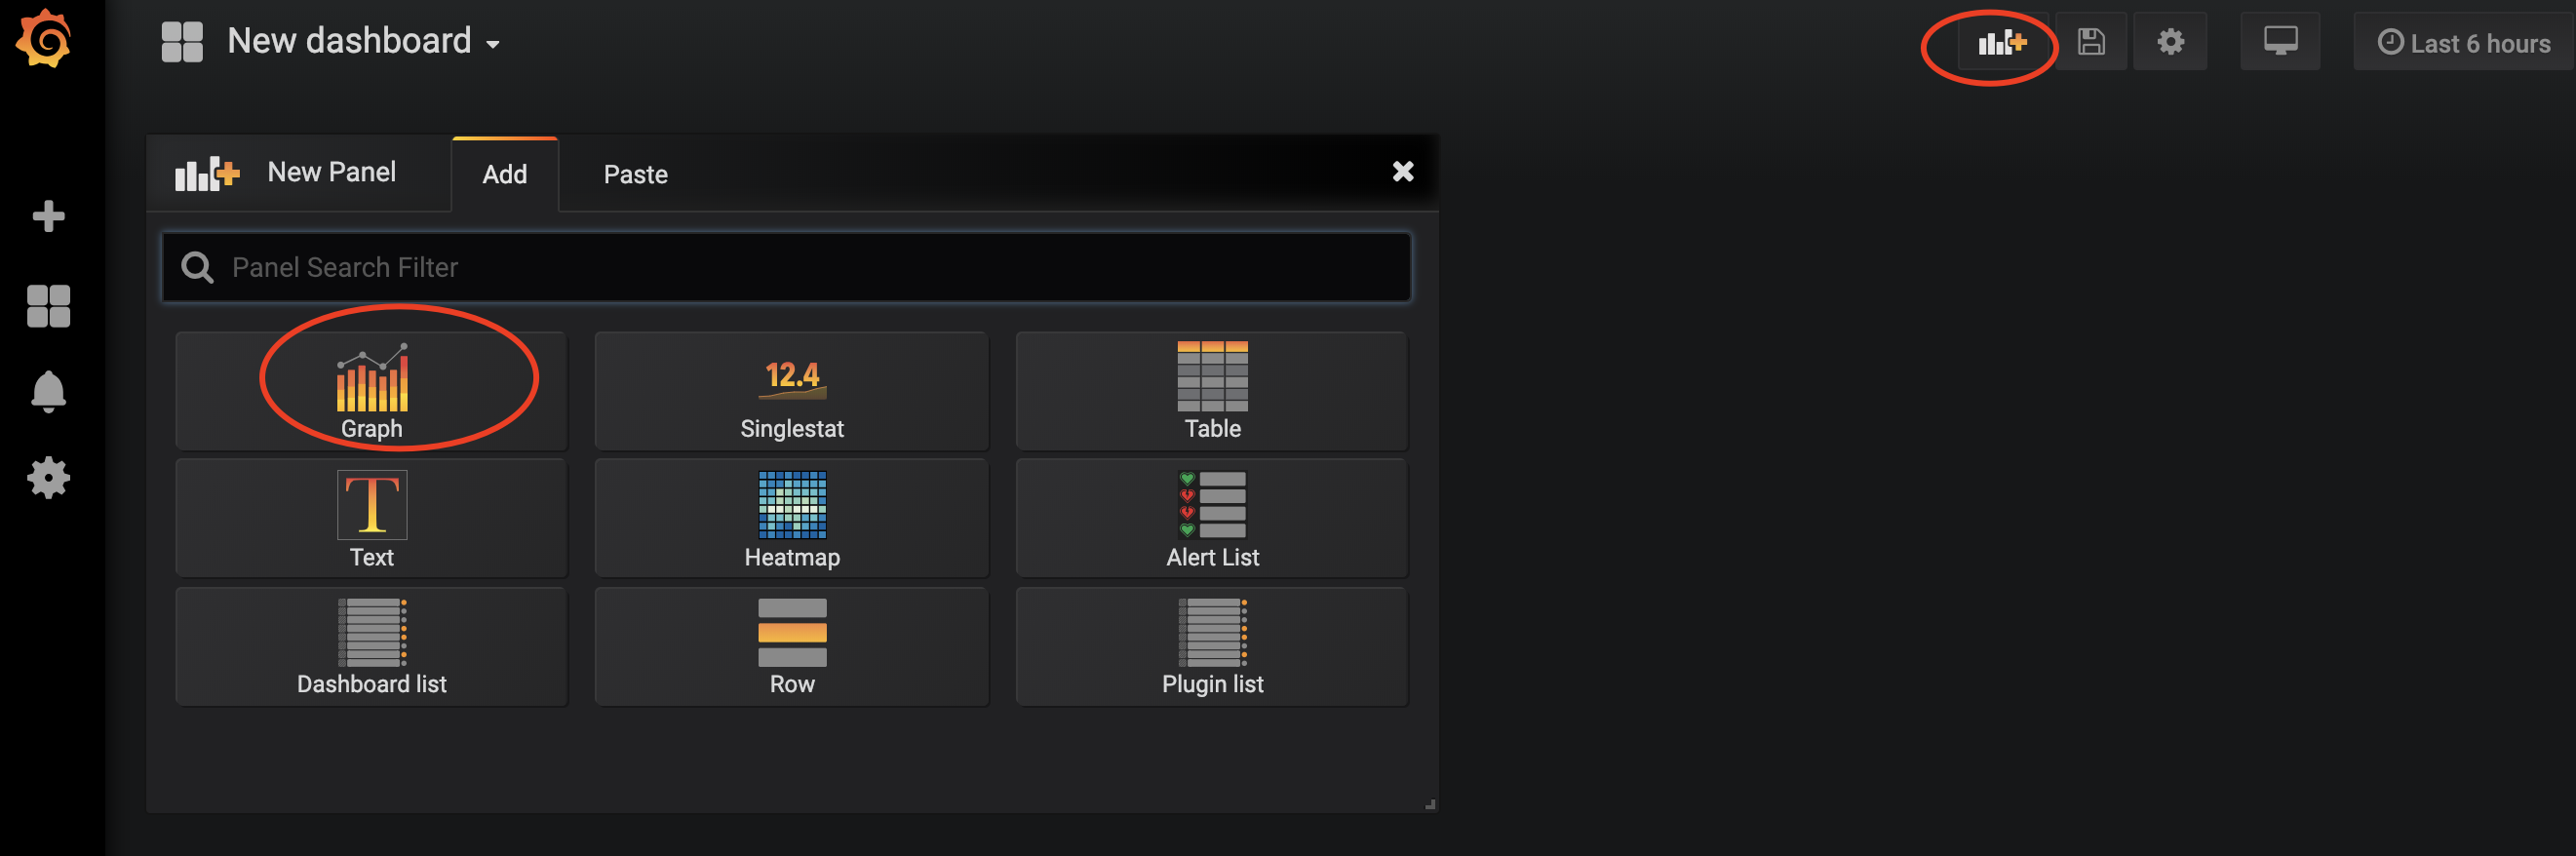
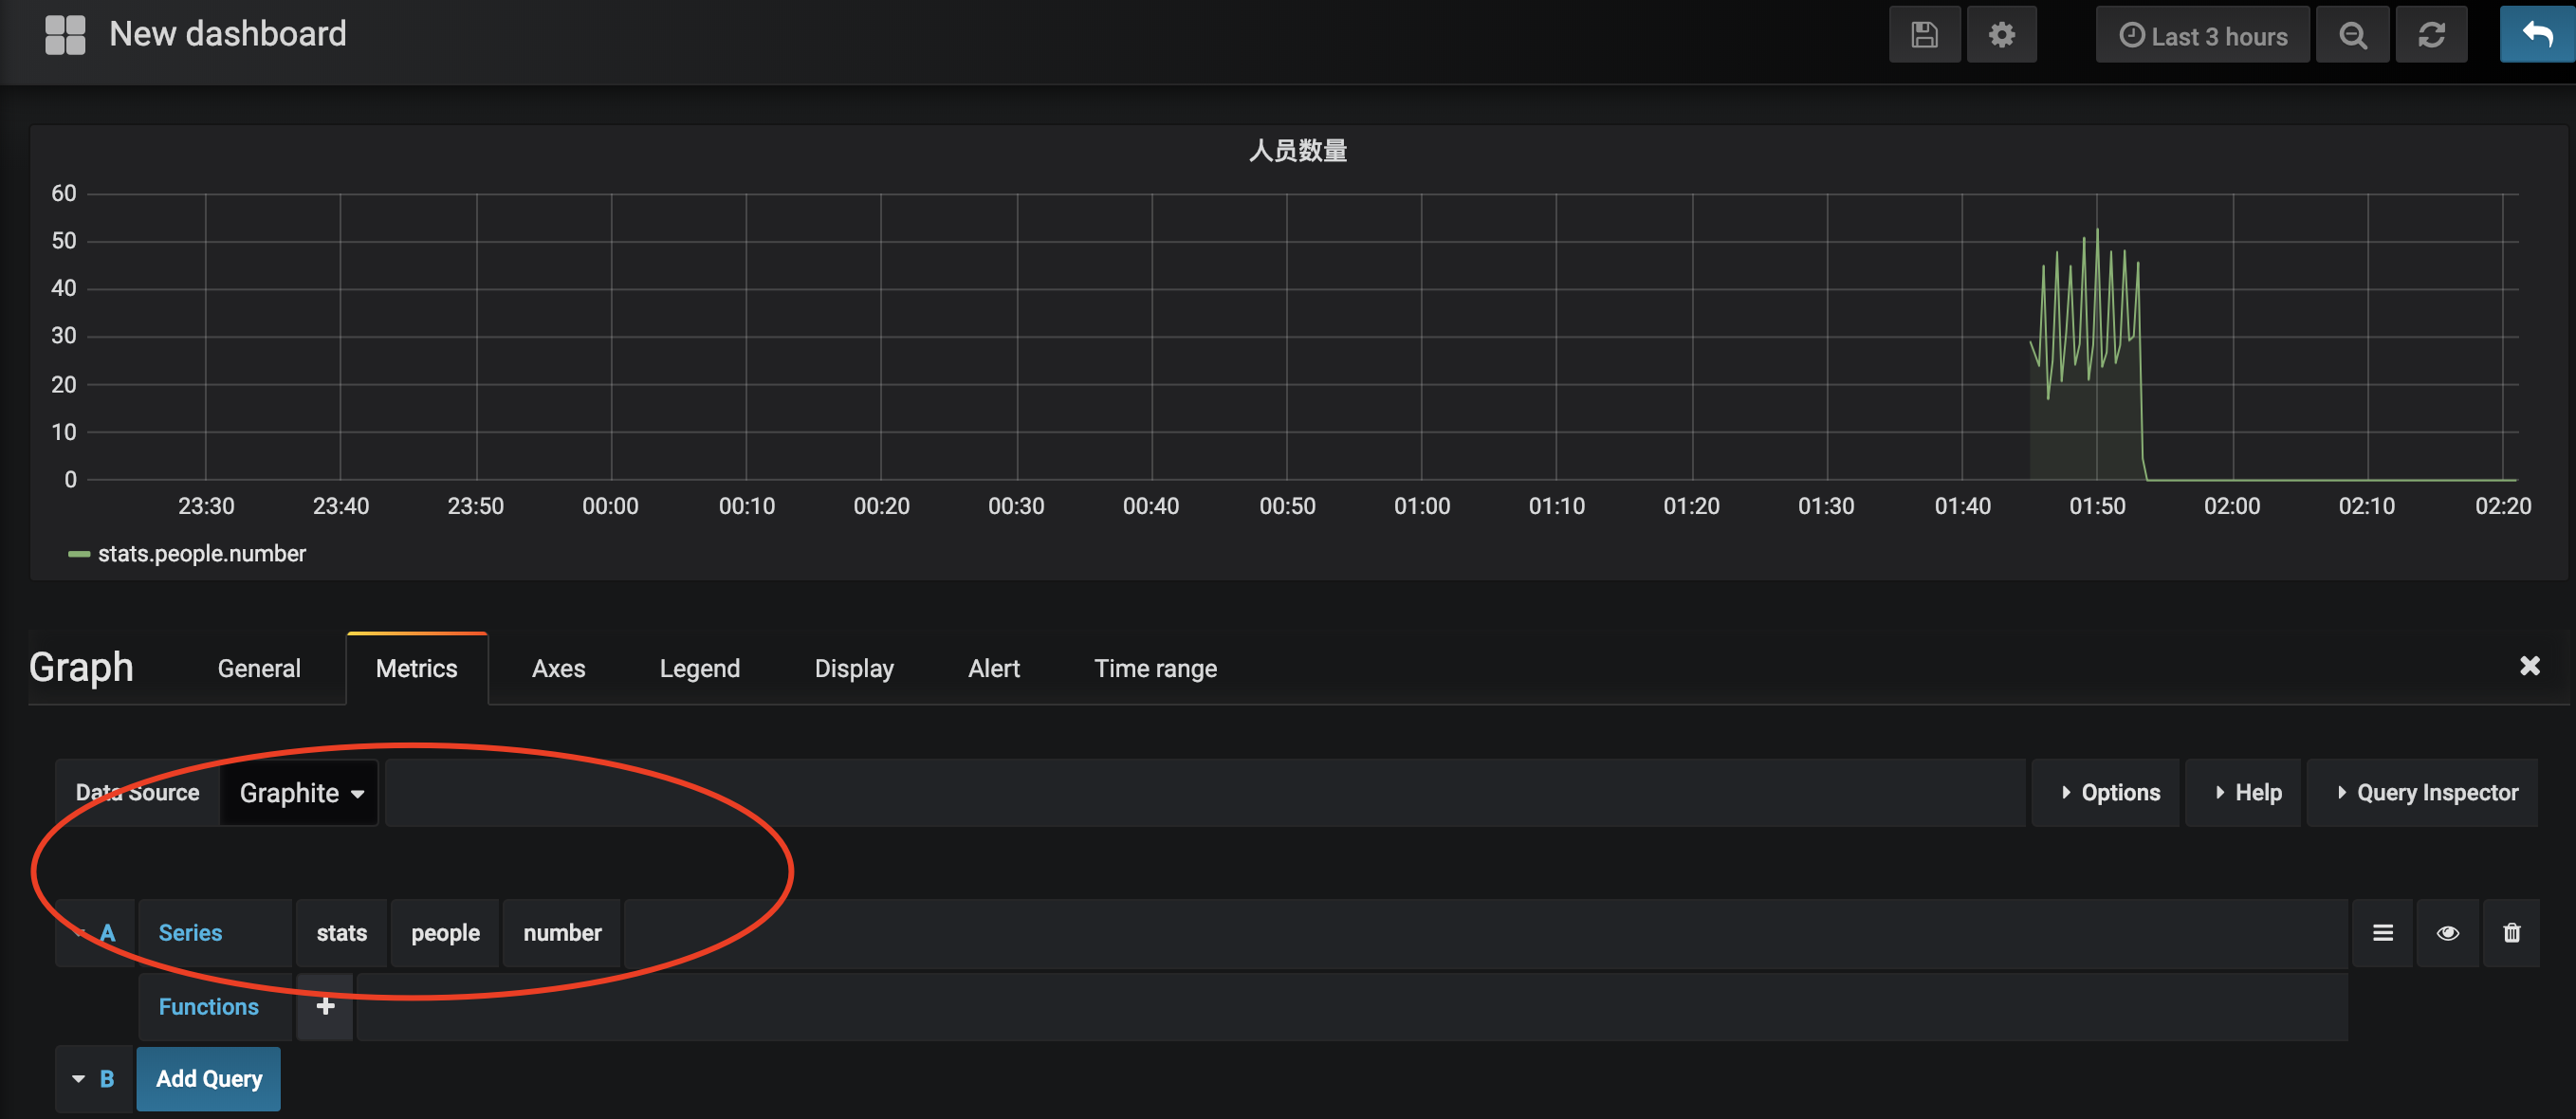
设置Grafana图表
You don’t know about real loss, because it only occurs when you’ve loved something more than you love yourself. - Sean